Market Trends 101 By Adrian H.
Introduction to Technical Analysis
This was written by a great friend during my adventure into technical analysis for stock prediction. It is one of the primary documents I refer to whenever I want to review the fundamental of how trend work. It is an extremely simple concept some nuances you will find useful.
If you’re still out there Adrian I miss you and hope you’re doing well.
Note: Some of this document may be a little difficult to read as he was a native Spanish speaker.
Prologue
In markets, the definition of Trend is in fact the most simple, basic and important concept among all, still, after reading this small manual, you´ll realize that what most people think trends are in reality just a derivation of a very more simple expression; Sadly, even though the concept of trend is really simple, it is quite difficult to apply it without proper practice and knowledge, but the more charts you eat and the more you practice by following the right structure, trends will start to pop to your eye and markets will start to make more and more sense, day by day, not only in markets but also in your daily life, so, let´s start.
This paper will not focus on classical technical analysis definitions, such as support or resistance, market indicators, moving averages, market cycles, Elliot Waves, Wyckoffian Structures or any other concept; This paper will only focus on the most important and basic concept among all, The Market Trend, Why? Because every other market tool, definition, indicator or methodology is derived from The Trend concept, and studying the most basic and important concept in markets will allow you to understand everything else more easily and clearly.
Module 1: What is a trend?
By Oxford definition:
“A trend is a general direction in which something is developing or changing”
Trends can be found every aspect of our daily life and most of them are ruled by pretty much the same laws; we can find them in your daily habits, like how much cups of tea you have in a week for example, one week can be less than the other, maybe because of stress, who knows; Movies, how have the super hero movies releases increased during the last decade?; Environment, how much has temperature fluctuated year by year in your home town?, how has this affected your monthly energy payments?; Food, how much have prices increased during this last few months?, which one are the ones that increased less, more and which ones decreased?; Markets, what about markets, when you talk about markets, you´re talking about trends, either prices are going up or down.
All of the prior describes a general direction or something in specific that is developing or changing.
Module 2: Market´s definition of Trend
Applied to markets, the direction of something (let’s call it a security, commodity, currency, token, wages or whatever you feel comfortable), is developing or changing, of course we´re talking about price development and change.
So, how can we translate this all this narrative into something productive and graphically understandable? Simple:
“A market trend is a price succession that creates consecutive highs and lows”
For markets that are going up or rising:
“An uptrend is a succession of Higher Highs (HH) and Higher Lows (HL)
For markets that are going down or declining:
“A downtrend is a succession of Lower Lows (LL) and Lower highs (LH)
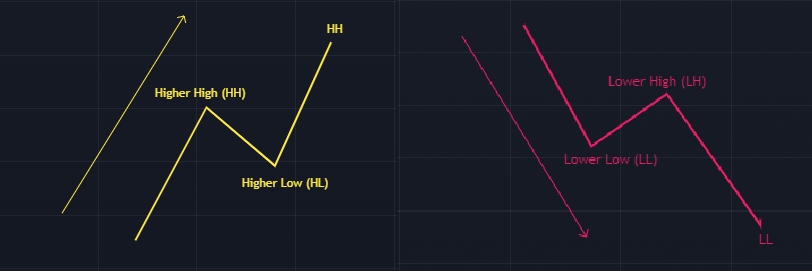 Figure 1 Uptrend and Downtrend
Market either goes up or down all the time, there is always a trend regardless of the time frame or scale, they expand and contract getting weaker or stronger, but there is always a trend and must be identified because it is the only certain thing in markets, everything else is ambiguous, but the trend is always there and must be respected.
As a Market participant, your main priority must be:
To always have the trend spotted and defined through highs and lows concepts, because the trend is ABSOLUTE and it is the only certain thing in markets, if there is no higher lows, there is no uptrend, if there is no lower high, there is no downtrend
By understanding this simple concept, it will allow you to have a good understanding of what is going.
Module 3: Deeper in Market Trends: How market trends behave and why
Now that we know what a trend is, let´s get a little bit deeper, not too much, just the necessary in order to fulfill this paper´s purposes, which is, understanding trends and learn how to read them.
When talking about Trends and Markets, we can´t avoid talking about the Three Fundamental Market Laws or the Three Wyckoff Laws; Richard Wyckoff was legendary trader and investor during the 1900s, during this age, he was considered as relevant as Charles Dow, J.P. Morgan and R. N. Elliot themselves. During his times, he was so sick of seeing people losing their life savings on markets that decided to create The Ticker Magazine, later known as The Magazine of Wall Street, which whole purpose was to spread knowledge through market analysis. His work was so popular among small and big investors, he ended up writing several books, endless articles and even more month to month publications such as the ones released on his other exclusive magazine The Trend Teller, this one included buying and selling recommendations.1
Richard Wyckoff was a technical analysis pioneer2, his whole method was based on Trend analysis through pure supply, demand, price action and volume; during his time, he defined the Three Fundamental Market Laws, or as they´re known today, The Three Wyckoff Laws.
The Three Wyckoff Laws3:
1. The law of Supply and Demand
This Law in specific is what everything revolves around. Price on whatever thing, asset or service is the result of the interaction between a seller (supply) and a buyer (demand), when the amount of buyers exceed the amount of sellers an imbalance is created, this imbalance is equal to demand exceeding supply, moving prices higher in consequence. On the other hand, when the opposite happens and the imbalance reverts, the amount of sellers exceed the amount of buyers or supply exceeding demand, prices decline. Pretty simple.
Let´s say there is a never ending fight between supply and demand to find balance and imbalance. When the imbalance is created it could happen by one of the following reasons:
- By a lot of interest in buying (Prices rise, demands exceed supply).
- By a lot of interest in selling (Prices decline, supply exceeds demand)
- Lack of interest in selling (Prices rise, demand exceeds supply because there is no interest to sell).
- Lack of interest in buying (Prices decline, supply exceeds demand because there is no interest to buy).
2. The law of Cause and Effect
On this Law, Wyckoff stated that every move in price has a reason and whatever happens is not aleatory nor random by any means, it has a reason of existence.
3. The law of Effort vs. Result
On this Law, Wyckoff describes trends in function of how strong supply and demand are relative to each other.
We could say that The Three Wyckoff Laws or the Three Fundamental Market Laws provide harmony or chaos to the market by working all together spinning around supply and demand and around each other.
As an example, we know an Uptrend is a succession of higher highs and higher lows in prices (Figure 1), they go up and down as The Law of Supply and Demand defines, prices rise when demand is greater than demand, and go down when supply is greater than demand. During the brief decline in prices on the ongoing uptrend if the imbalance is still in favor of demand the market will provide enough strong buying effort (cause) to sustain the higher low, create a new high and continue the trend as a result (effect). On the contrary, if the imbalance remains in favor of supply overcoming demand, the market will provide enough selling effort (cause) to create a new lower low and lose the trend as a result (effect). No higher low no uptrend. This analogy works both ways, for uptrends and downtrends, since it is all in function of how strong or weak supply or demand are.
Module 4: Deeper in Market Trends - Applied basic trend analysis
Now that we know the why, let’s move to the how trends behave in function of the Three Wyckoff Laws.
As we saw in Figure 1, a trend is just a succession of highs and lows, this succession creates waves, an upside wave or a downside wave.
When a trend creates a new wave a range is created as well, this range is defined by the consecutive high and low as shown on Figure 2, we call this, a Trading range.
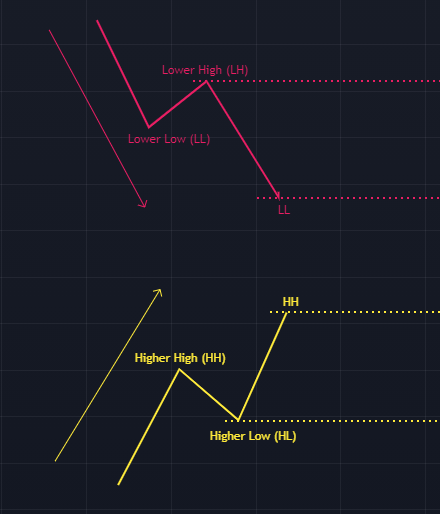 Figure 2 Trend Ranges
A trading range is the area where price will be clustered inside the new wave until it finds its way out, either continuing trend or losing it and reversing in consequence; in order to do such thing, price will oscillate inside the range in form of smaller trends as shown on Figure 3.
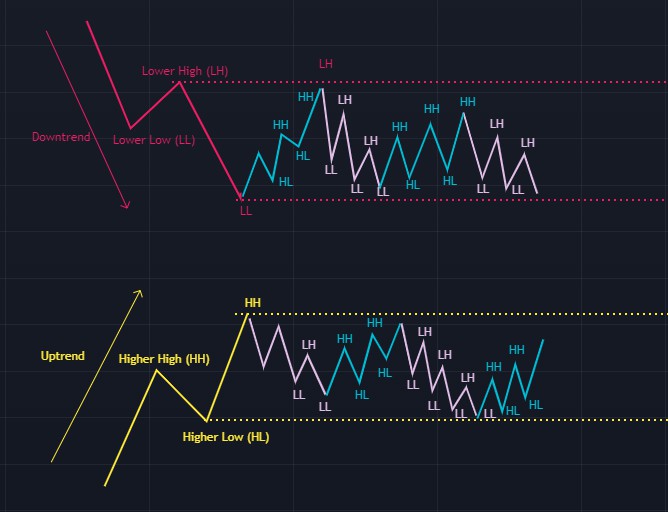 Figure 3 Creation of a Trading Range
When price is inside the most recent wave trading range, the smaller trends will show the real fight between supply and demand, it is a period where the imbalance that was ruling the main or principal trend is being re-defined as form of smaller trends with their own highs and lows, this smaller trends test and reverse each other over and over. The process will continue until the imbalance is strong enough to continue or reverse the trend.
If the imbalance remains in favor of the principal trend it will continue through its original way as shown on Figure 4 and a new wave will be created as, again, a new high and a new low along with a new trading range, this is how trends find continuation.
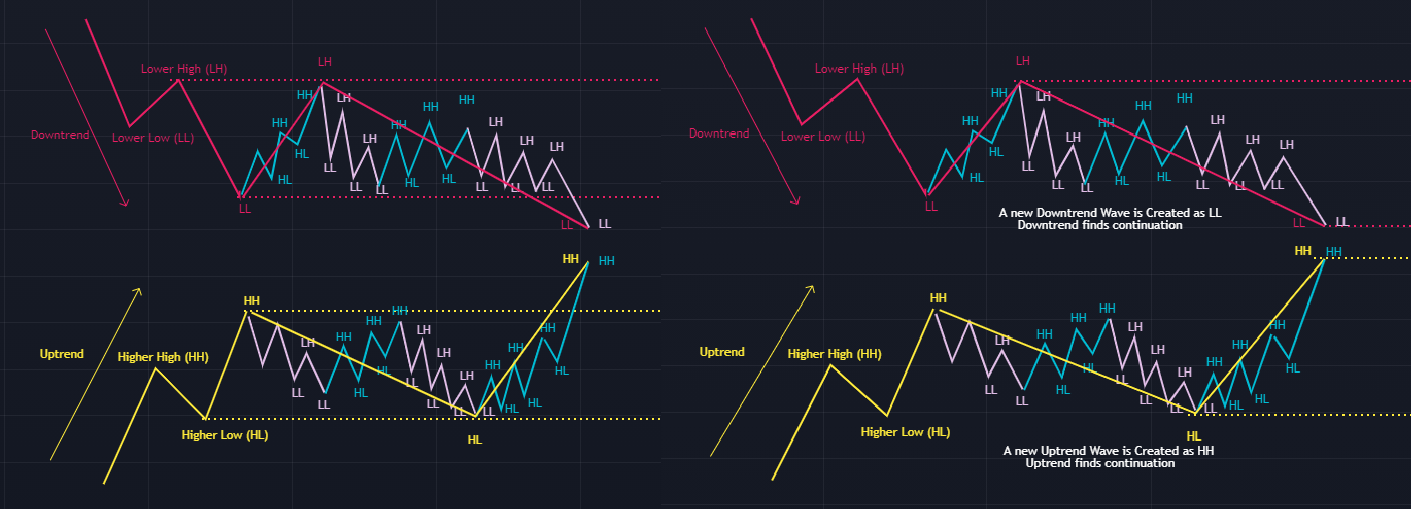 Figure 4 New Wave and Trading Range Creation as Trend continuation
On figure 5 we can see an example of all of this, I personally to recommend General Electric´s chart for trend learning and practicing, since its price action is so clean, we can identify the trend, its highs, lows, ranges and inside trading range smaller trends quite easily.
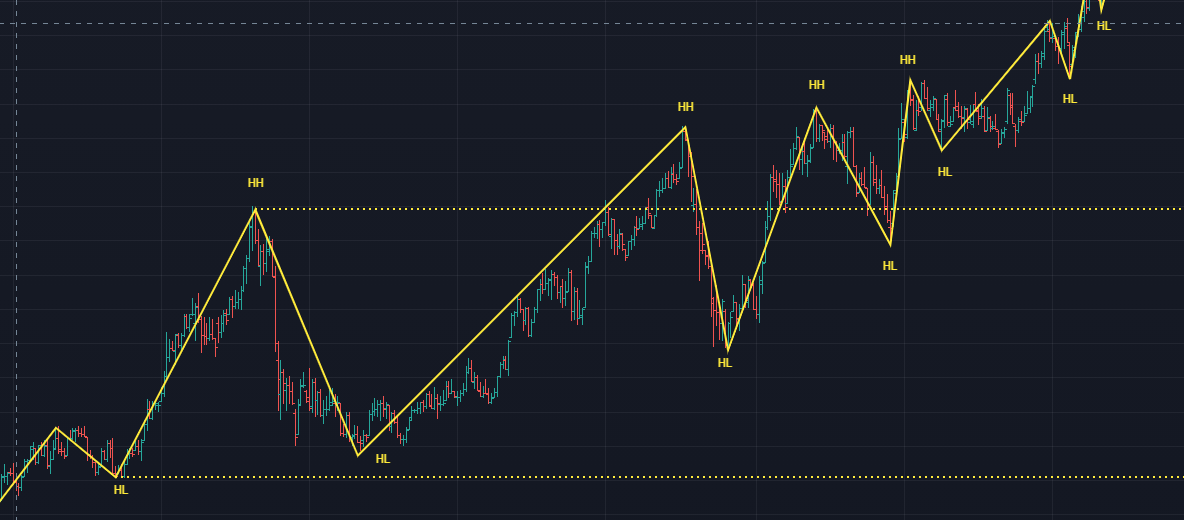 Figure 5 General Electric Uptrend trend and Ranges
We could say and conclude then, that for an uptrend, the most important thing is to identify its ability to keep defending every higher low and finding higher highs, creating new up waves in consequence.
On figure 6 we can see General Electric´s downtrend and ranges as well, where lower highs and lower lows are clear, as well as the ranges and inside range trends they create.
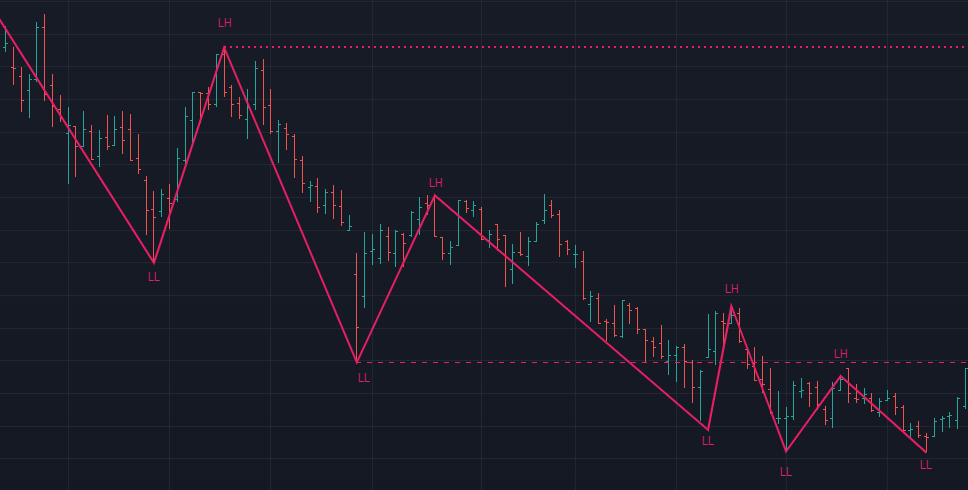 Figure 6 General Electric Down trend and Ranges
We could say and conclude then, that for a downtrend, the most important thing is to identify its ability to keep defending every lower high and finding lower lows, creating new down waves in consequence.
Conclusions In function of The Three Wyckoff Laws for Market Trends Continuations:
For an Uptrend:
If demand is strong enough as a cause, it will provide enough buying effort (cause) to sustain the trend´s higher Lows and create a new Highs (Effect).
For a Downtrend:
If supply is strong enough as a cause, it will provide enough selling effort (cause) to sustain the trend´s lowers highs and create new Lows (Effect).
As a general rule and recommendation:
While spotting trends, you have to zoom in and out as much as you need until you clearly spot the highs and lows that define the trend, the bigger the better, because remember, the trend´s wave are also compounded by smaller waves or smaller trends as shown by the trading range explanation.
Now that we know how trends continue, we have to look at the opposite side of the coin, how trends are lost, for this, the logic is pretty much the same.
As we have defined before, if an uptrend is unable to sustain a Higher Low and loses it, means demand wasn’t strong enough to sustain it, for instance, the uptrend is lost, creating a new downtrend in consequence, no higher lows, no uptrend.
For instance, if a downtrend is unable to sustain the Lower Highs, means supply wasn’t strong enough to sustain it, for instance, the downtrend is lost, creating a new uptrend in consequence, no lower highs, no downtrend.
This is what we call a shift and trend reversal or, how I like to name it Trend Invalidation (Figure 7), and, as simple as it sounds, it is one of the most powerful tools you can have for spotting early warnings on a market that is about to run 180°C around, and as simple as it is, most people ignore it.
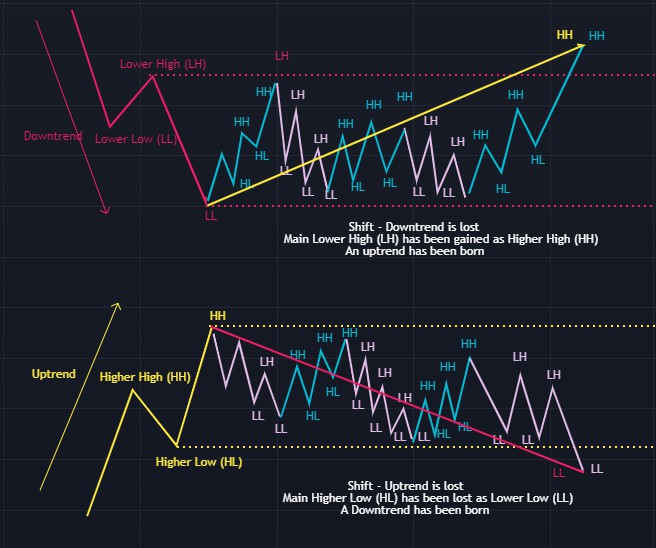 Figure 7 Trend invalidation
When the old trend is invalidated means market wasn’t strong enough to sustain the ongoing trend and it reversed, giving birth to a new trend in consequence with the opposite forces in absolute control, and as we know, the new trend will start feeding itself the other way around developing its own new ranges and consequent waves as a brand new trend and the cycle starts again, as shown in Figure 8 and Figure 9.
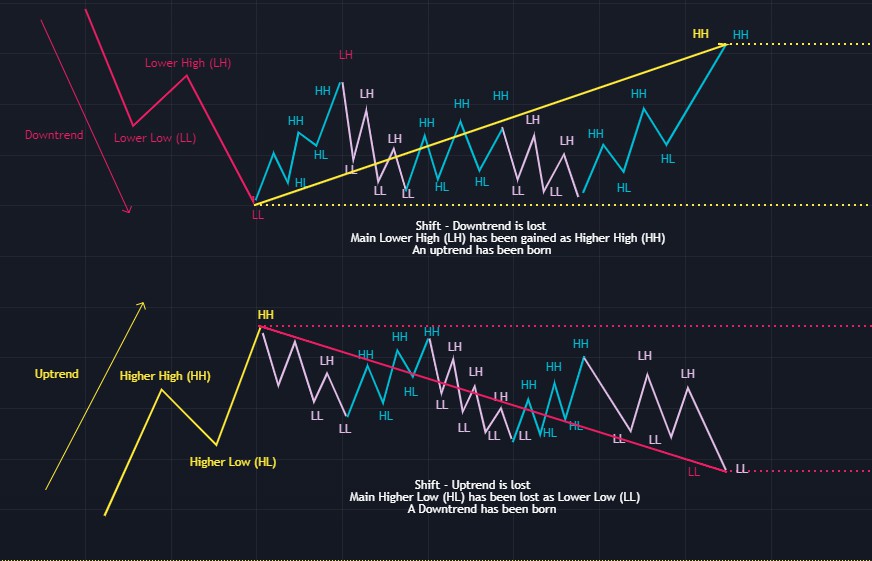 Figure 8 The creation of a Brand New Trend
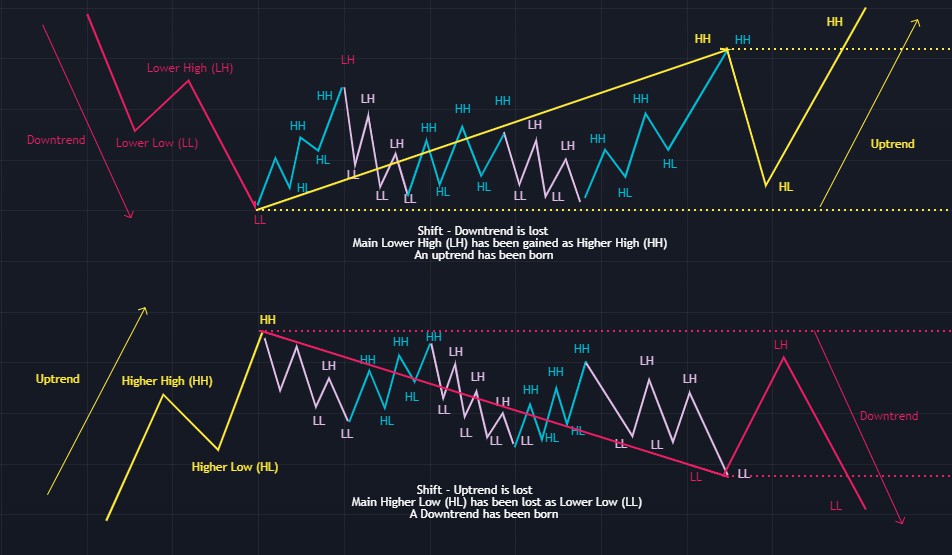 Figure 9 The continuation of a Brand new Trend
Since good things never get old, let’s go back to our good old friend General Electric that will clearly show us the example why understanding trends are is so important and powerful.
On figure 10, we can see General Electric´s market reversal, it clearly shows how the Uptrend was lost and a new Downtrend was created.
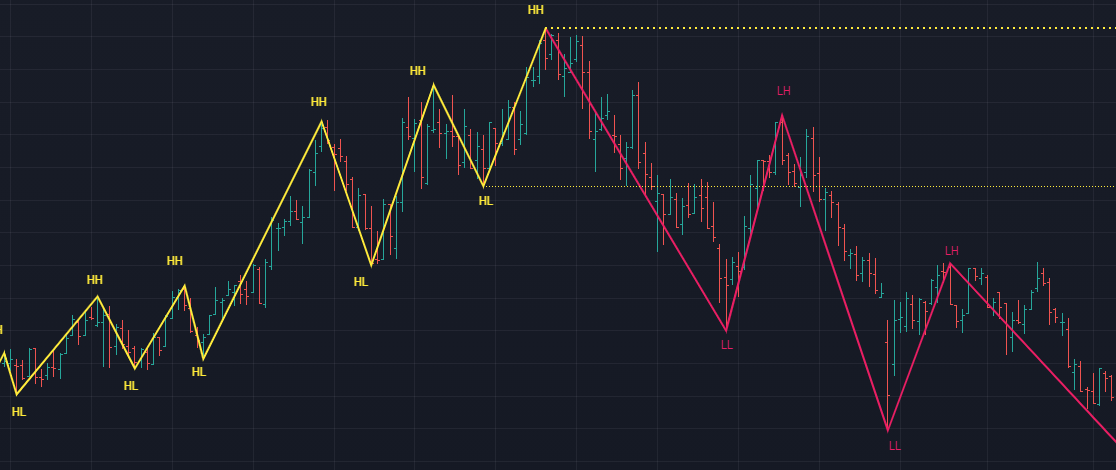 Figure 10 General Electric Market Trend Reversal
To make it more dramatic, let´s have a look at the outcome of Figure 10, on figure 11.
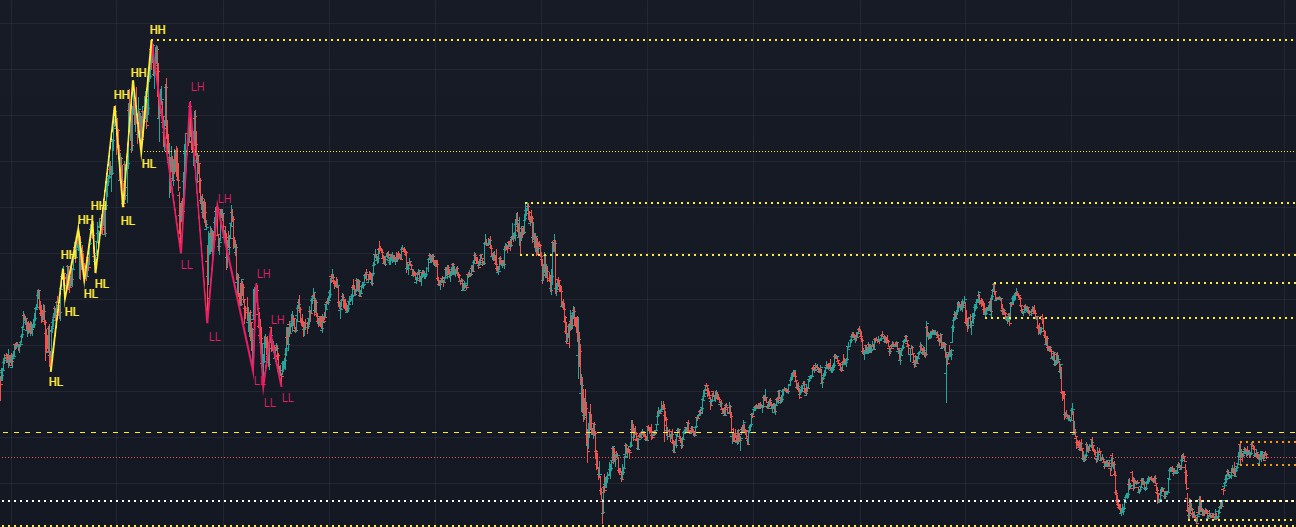 Figure 11 General Electrict Outcome after Losing the Trend
Quite ugly, isn’t it? 90% decline, and just look at what happened next, I marked the trading range of the last Wave high during the following 2 moves high. 20 years of market price and trend ruled by the most basic concepts among all, the trend.
Let’s now do the opposite with the good GE; On figure 12, we can see how GE gains the trend again after losing around 80% of its value, setting a succession of clear Higher Highs and Higher Lows as an uptrend, doubling its value until market finally reversed once again.
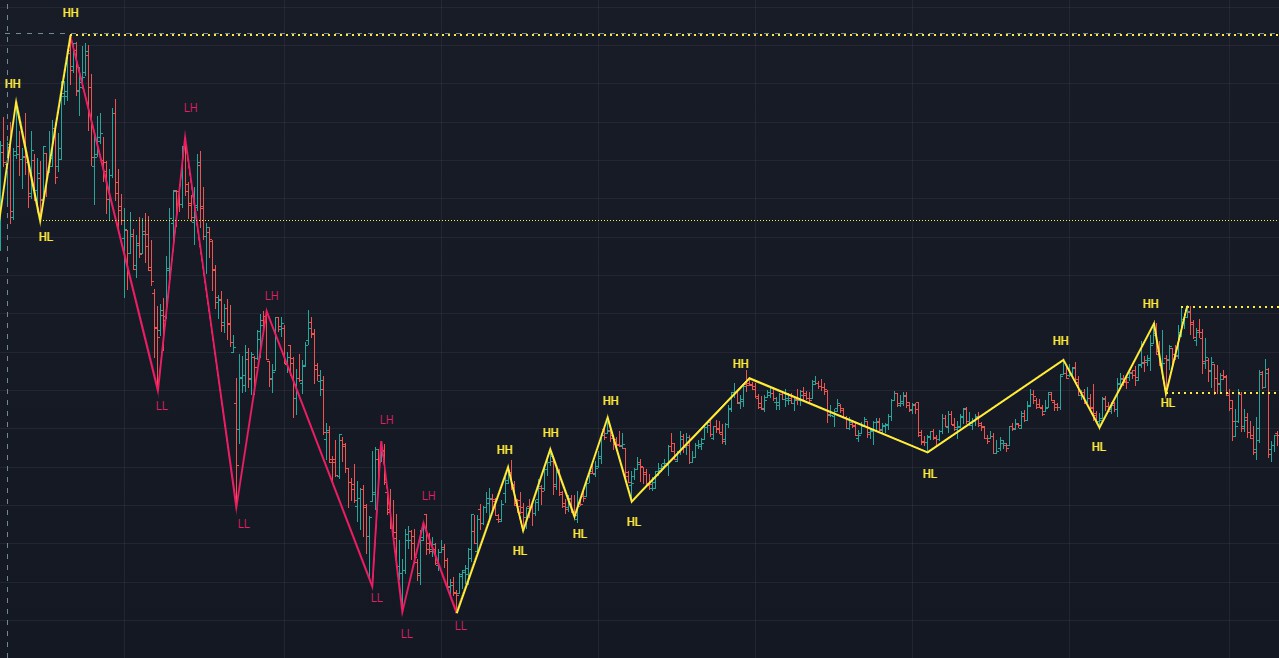 Figure 12 General Electric Market Trend Reversal No.2
Conclusions In function of The Three Wyckoff Laws for Market Trends Reversals and invalidation: For an Uptrend:
If demand is not strong enough as a cause, it will not provide enough buying effort (cause) to sustain the trend´s Higher Low, for instance, Supply will be strong enough to create a new Lower Low and invalidate the uptrend, creating a Down in consequence (Effects).
For a Downtrend:
If supply is not strong enough as a cause, it will not provide enough selling effort (cause) to sustain the trend´s Lower Highs, for instance, Demand will be strong enough to create a new Higher High and invalidate the downtrend, creating an Uptrend in consequence (Effect).
As a general rule:
The Market Trend is absolute and will continue until it is lost and invalidated
Module 5: General Conclusions
Before doing any final comment, I´d like to recapitulate and summarize the most important concepts in trends among this paper.
The Oxford definition of Trend:
“A trend is a general direction in which something is developing or changing”
The definition for Market Trend:
“A market trend is a price succession that creates consecutive highs and lows”
The definition for Market Uptrend:
“An uptrend is a succession of Higher Highs (HH) and Higher Lows (HL).”
The definition for market Downtrend:
“A downtrend is a succession of Lower Lows (LL) and Lower highs (LH).”
The Three Fundamental Market Laws, or as they´re known today, The Three Wyckoff Laws.
- The Law of Supply and Demand.
- The Law of Effort and Result.
- The Law of Cause and Effect.
Trends Basics:
- The Market is always trending regardless of the time frame or scale.
- Trends Behave in Waves, they expand and contract.
- Every Wave creates a trading range with inside smaller trends.
- The smaller trends will continue inside the range, testing and invalidating each other until the imbalance between supply and demand is strong enough to find its way out of the range and continue or reverse and invalidate the trend.
For an Uptrend Continuation:
“If demand is strong enough as a cause, it will provide enough buying effort (cause) to sustain the trend´s higher Lows and create a new Highs (Effect).”
For a Downtrend Continuation:
“If supply is strong enough as a cause, it will provide enough selling effort (cause) to sustain the trend´s lowers highs and create new Lows (Effect).”
For an Uptrend reversal and invalidation:
“If demand is not strong enough as a cause, it will not provide enough buying effort (cause) to sustain the trend´s Higher Low, for instance, Supply will be strong enough to create a new Lower Low
and invalidate the uptrend, creating a Down in consequence (Effects).”
For a Downtrend reversal and invalidation:
“If supply is not strong enough as a cause, it will not provide enough selling effort (cause) to sustain the trend´s Lower Highs, for instance, Demand will be strong enough to create a new Higher High and invalidate the downtrend, creating an Uptrend in consequence (Effect).”
As a general rule:
“The Market Trend is absolute and will continue until it is lost and invalidated”
As a Market participant, your main priority must be:
“To always have the trend spotted and defined through highs and lows concepts, because the trend is ABSOLUTE and it is the only certain thing in markets, if there is no higher lows, there is no uptrend, if there is no lower high, there is no downtrend.”
As a general rule and recommendation:
“While spotting trends, you have to zoom in and out as much as you need until you clearly spot the highs and lows that define the trend, the bigger the better, because remember, the trend´s wave are also compounded by smaller waves or smaller trends as shown by the trading range explanation.”
Module 6: Final Comments
As Mentioned in the Prologue, every concept, indicator and methodology in markets is derived from the Trend concept, understanding it from its most basic and simplistic expression will allow you to expand improve your market understanding and receptivity of other more complex and robust methodologies such as Dow Theory,Wyckoff, Elliot or whatever indicator you want to study and apply.
Doesn’t matter if your goal is to become a long term investor, swing trader or a day trader, at the end, all of them must consider the trend as a fundamental variable to invest, hold or disinvest on whatever asset class, since the trend has to be defined every day, every week, every month and every year.
Your homework from now it´s to start eating charts and start practicing how to define the trend and the ranges by applying this paper´s concepts, so your eyes get trained and you develop the habit and muscular memory to automatically spot trends before anything else.
When you are finally in shape and you´re able to properly spot trends, the next step is to get into price action and risk management which is a deeper and applied version of trends behavior that will allow you to identify, take and properly operate trading and investment opportunities. From that follows structure through Wyckoff Structural Analysis, which focuses on spotting market cycles for long term investment opportunities and long term capital gains.
Markets can be fun and frustrating, but learning the RIGHT things such as this paper will allow you to minimize the pain to its minimum.
1 El Método de Wyckoff - Enrique Díaz Valdecantos, p34
2 https://school.stockcharts.com/doku.php?id=market_analysis:the_wyckoff_method
3 El Método de Wyckoff - Enrique Díaz Valdecantos, p48-50